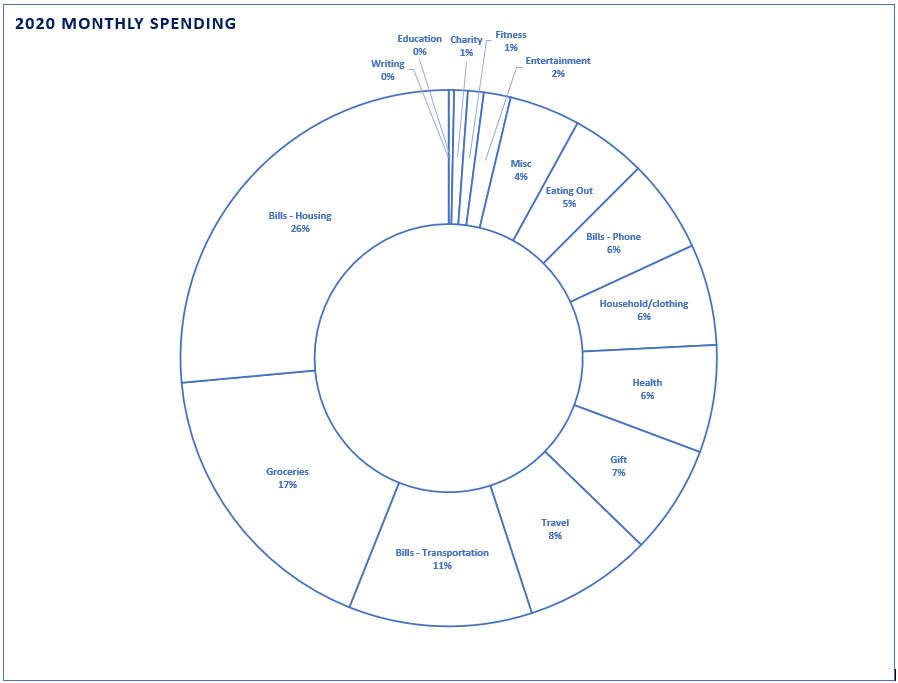
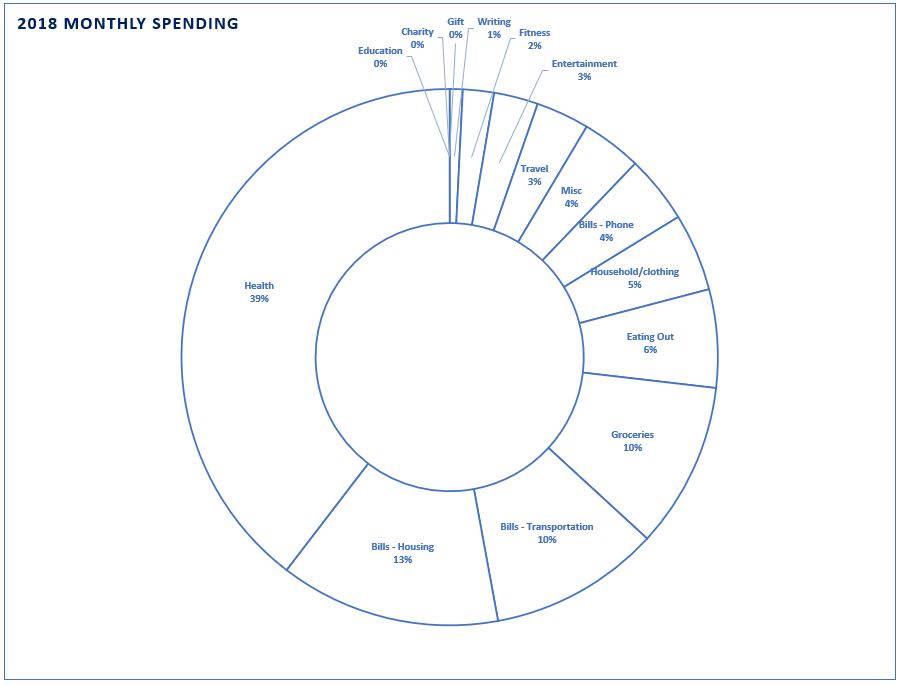
Here are some charts I made to compare my monthly spending over 2021, 2020, 2019, and 2018. I included taxes and my HSA withholdings in my most recent 2021 chart as well as my Roth IRA contributions. The purpose of these charts is to show changes in spending over time (across different categories).
Here are a few more fun numbers:
- I increased my spending 12% from 2020 to 2021, while increasing my income 2.5% (I increased my spending 4% from 2019 to 2020 while increasing my income 3%)
- I bought a house in May of 2021, which became 13% of my monthly spending as averaged by 12 months of the year, effectively doubling my ‘housing’ spending category to 26% of my earnings
- The house I bought increased in value 20% since I bought it according to Zillow/Redfin
- My credit score increased by 3.8% (28 points)
- My investment portfolio changed because I had to sell some general investment stocks to have enough cash to afford my house purchase
- Notable increases in spending from 2020 to 2021 include:
- Fitness – 736% because I switched studios and was paying cash for classes instead of using trade money
- Eating out – 128% increase (my partner and I decided to switch to me paying for groceries and him paying for eating out midway through the year)
- Groceries – 25% increase (see eating out above point)
- Bills-housing – 8% increase when we moved
- Notable decreases in spending from 2020 to 2021 include:
- Health – 37% decrease since I am more crafty with my supplement purchases
- Household and clothing – 32% decrease as I’ve been able to use Amazon gift cards for a lot of these items
- Bills-Transportation – 19% decrease since our car is between mileage maintenance milestones
- I met my LLC goal of earning $5,000 and will be putting everything except taxes and expenses and $1000 for 2022 expenses into my 401k when I get the go-ahead from my accountant
- I had to gather almost all of my cash, savings, emergency fund, and stocks that weren’t retirement-allocated in order to come up with the cash necessary to buy my house so my emergency fund is now below $10,000 and I’m building it back up.
- My emergency fund is only worth 2 months’ spending since my spending increased with the additional house expenses and I decreased my emergency/savings fund to buy the house


The next two charts show my net worth split categories:
To note: I had a 53% increase in my assets from 2019 to 2020 and a 76% increase in my assets from 2020 to 2021.
To note: My investment portfolio increased 52% from 2019 to 2020 and 10% (without the real estate value) from 2020 to 2021 (or 323% if you add in the value of the real estate but don’t subtract the mortgage)
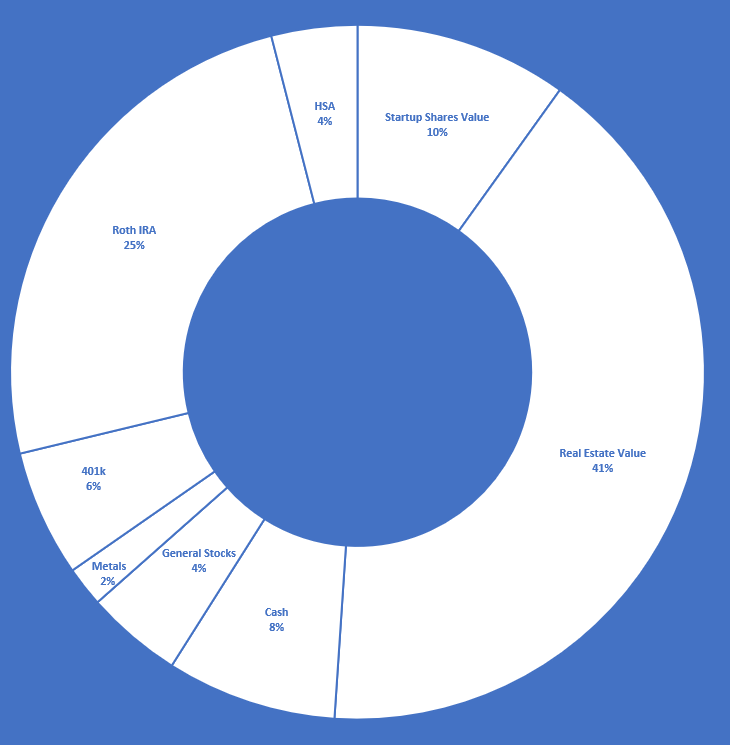
2021 Asset breakdown

