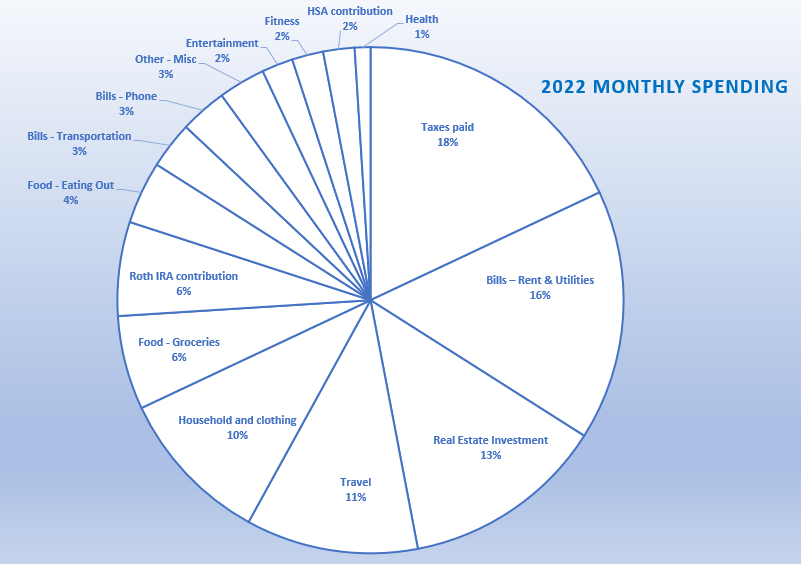
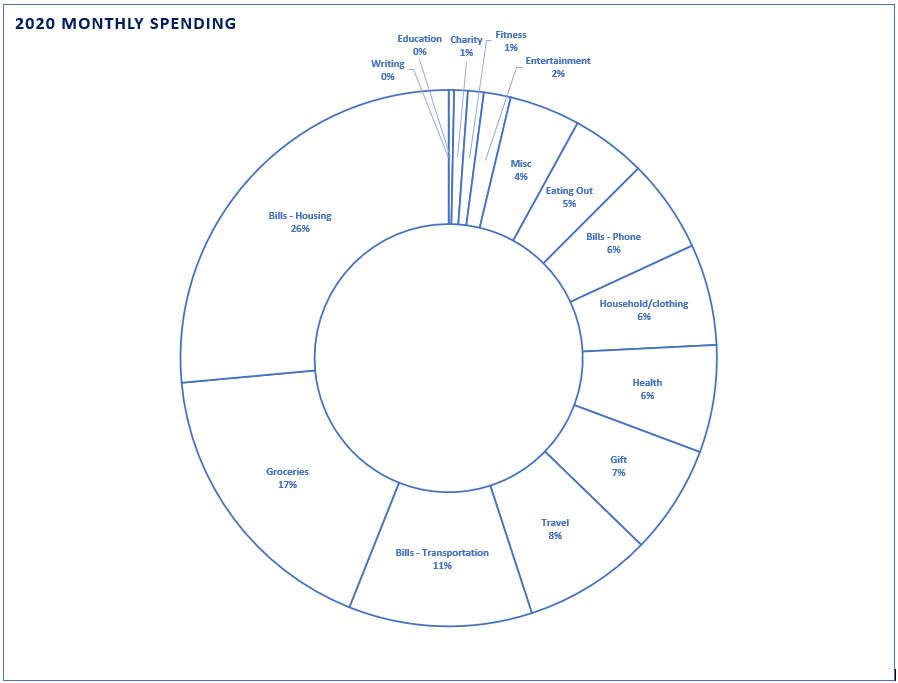
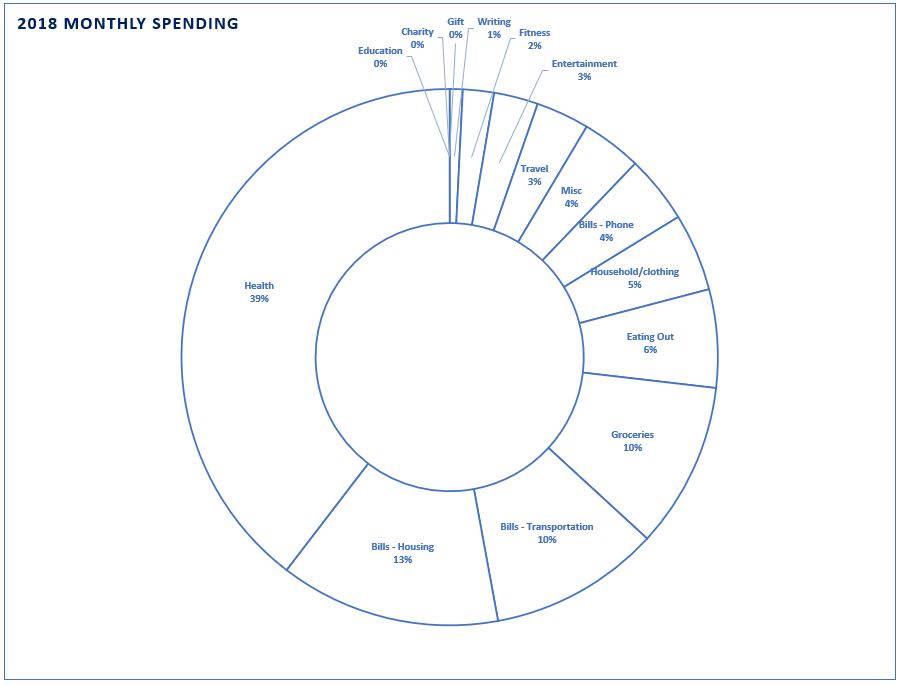
Here are some charts I made to compare my monthly spending over 2022, 2021, 2020, 2019, and 2018. The purpose of these charts is to show changes in spending over time (across different categories).
Here are a few more fun numbers:
- I increased my spending 39% from 2021 to 2022, while increasing my income 22% (I increased my spending 12% from 2020 to 2021 while increasing my income 3.5% and I increased my spending 4% from 2019 to 2020 while increasing my income 3%)
- The house I bought in 2021 increased in value 37% since last year
- My credit score increased and then decreased when I moved so it’s roughly the same number as where it was at the beginning of last year
- Notable increases in spending from 2021 to 2022 include:
- Household/Clothing – 603% increase due to moving twice and not owning the furniture, electronics, household goods etc. for our own place
- Travel – 345% increase due to several once-in-a-lifetime trips including a week at Disney and the Starcruiser hotel and a trip to Turkey
- Entertainment – 182% increase due to buying tickets to more expensive events like seeing Kevin Hart perform
- Bills housing/utilities – 59% increase due to moving into our own place and not splitting rent costs with another person
- Bills phone – 15% increase by moving to a higher plan on T-mobile in order to maximize the purchase of two iPhones this year
- Misc – 225% increase
- Notable decreases in spending from 2021 to 2022 include:
- Health- 56% decrease from not re-upping on some vitamins I had been purchasing in the past and sticking with the one that makes the most difference in my gut health. I only went to a doctor one time and an eye doctor one time so no large medical bills
- Fitness – 16% decrease from using gift cards to purchase classes and using my Ambassador funds from working at one of the studios
- Gifts – 80% decrease because of how I calculate and what I determine to be a gift.
- Groceries – 18% decrease
- Transportation – 9% decrease due to lower car maintenance costs in 2022 (my partner and I have one car and share expenses)
- I did not meet my LLC goal of earning $5,000, but was able to earn just over $4000 for the year
- I still have $10,000 in my emergency fund but since my bills have increased, if I need to use that to live on it won’t go as far


The next charts show my net worth split categories:
16% increase in my assets from 2021 to 2022
76% increase in my assets from 2020 to 2021
53% increase in my assets from 2019 to 2020
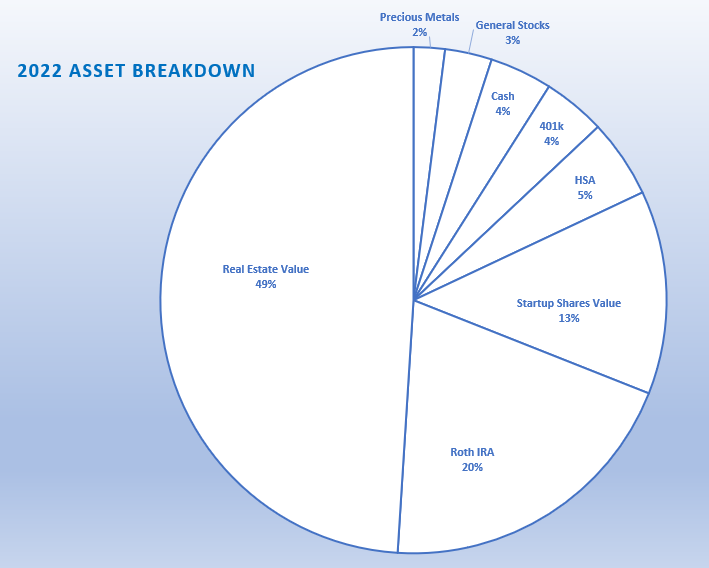
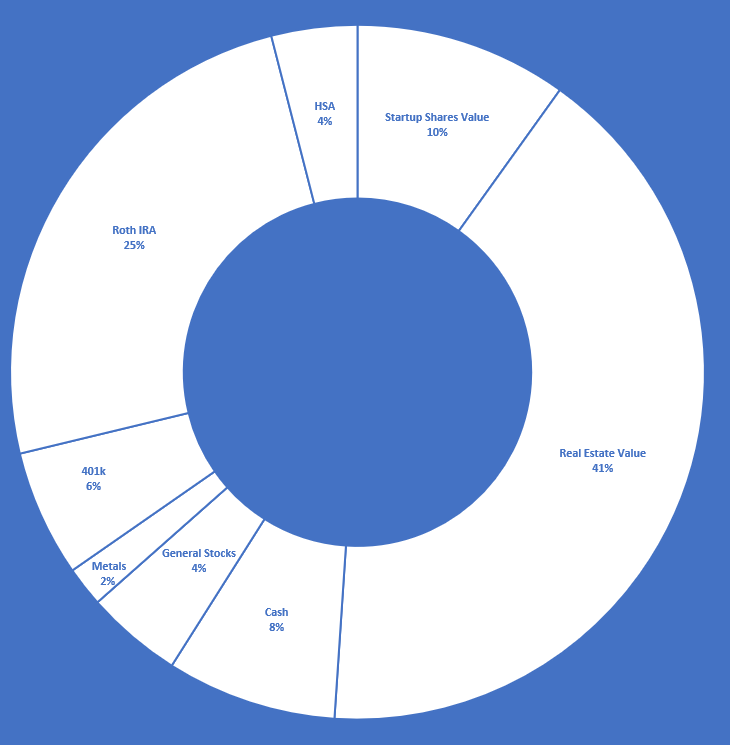
2021 Asset breakdown

