Finances Goals 2025
- Apply to 365 usability studies
- I applied for ~332 studies
- Make $2500 in side income, including study gift cards and cash
- Nailed it! From bank and credit card signup bonuses to selling things around the house and all the studies in between!
- Complete 4 mystery shops
- I completed 2 Bestmark shops in December because they were too good to pass up, but otherwise, I didn’t prioritize completing shops
- Spend less than I make
- Though I did make the money I spent earn as much as it could for me, I didn’t manage to meet this goal
Financial Accomplishments of 2025:
- I completed 22 studies and participated in 2 Reedsy Discovery book review challenges
- I earned just over $1000 from studies last year paid out in gift cards, credits, checks, and cash
- I’ve saved $139.42 on Too Good To Go for the year ($76.58 spent) with 14 bags (the app that lets you rescue unsold food at your favorite spots from an untimely fate and is typically 1/3 the cost of the retail value) $930 saved lifetime since 2022
- I earned $154.74 from browser extension Rakuten and $48 from receipt uploading (as gift cards)
- I earned 2 bank bonuses and got 2 credit card SUBs this year
- I got $325 in value from freebies (including my yearly birthday rewards, Amazon First Read books, Alamo level-ups, AMC investor connects, and Yelp Elite events)
- I snagged several phone upgrades through T-Mobile with their 24-month credits (iPhone 17 Pro Max for $263 after trade in, iPhone 17 Air for $94 after trade in, and an iPhone 17 free upgrade with trade in)
- I earned and spent ~$1480 in credit card rewards and have points worth ~$3600 that I’m saving for future travel
- I fully funded my Roth IRA for the year
Finances Goals 2026: no specifics this year
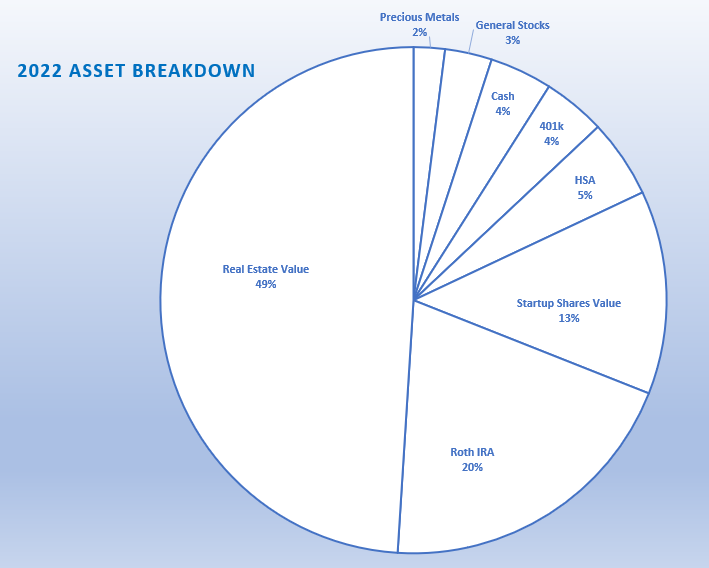
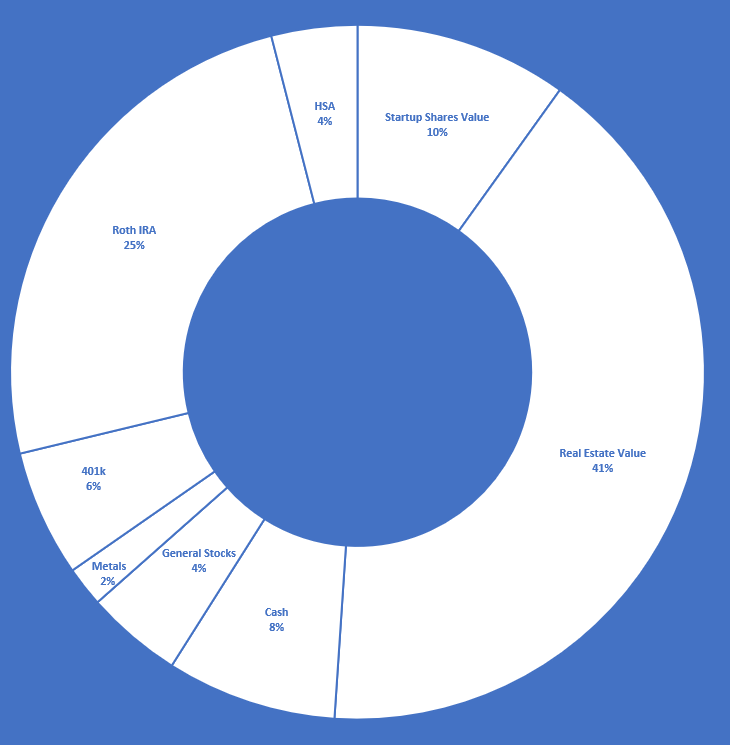
Let’s take a look at my assets (and net worth) and how they’ve changed over time:
| Asset | 2025 % of value | 2024 % of value | 2023 % of value | 2022 % of value | 2021 % of value | 2020 % of value | 2019 % of value |
| Stock Shares | 18% | 18% | 18% | 13% | 10% | 11% | 16% |
| Real Estate | 24% | 32% | 40% | 49% | 41% | 0% | 0% |
| Cash | 1% | 4% | 4% | 4% | 8% | 24% | 16% |
| General Stocks | 5% | 4% | 3% | 3% | 4% | 21% | 23% |
| Precious Metals | 3% | 2% | 2% | 2% | 2% | 3% | 4% |
| 401k | 6% | 5% | 4% | 4% | 6% | 7% | 8% |
| Roth IRA | 38% | 30% | 23% | 20% | 25% | 31% | 32% |
| HSA | 5% | 5% | 5% | 5% | 4% | 3% | 0% |
| Total net value | 0% increase | 2.6% increase | 18.5% increase | 16% increase | 76% increase | 53% increase |
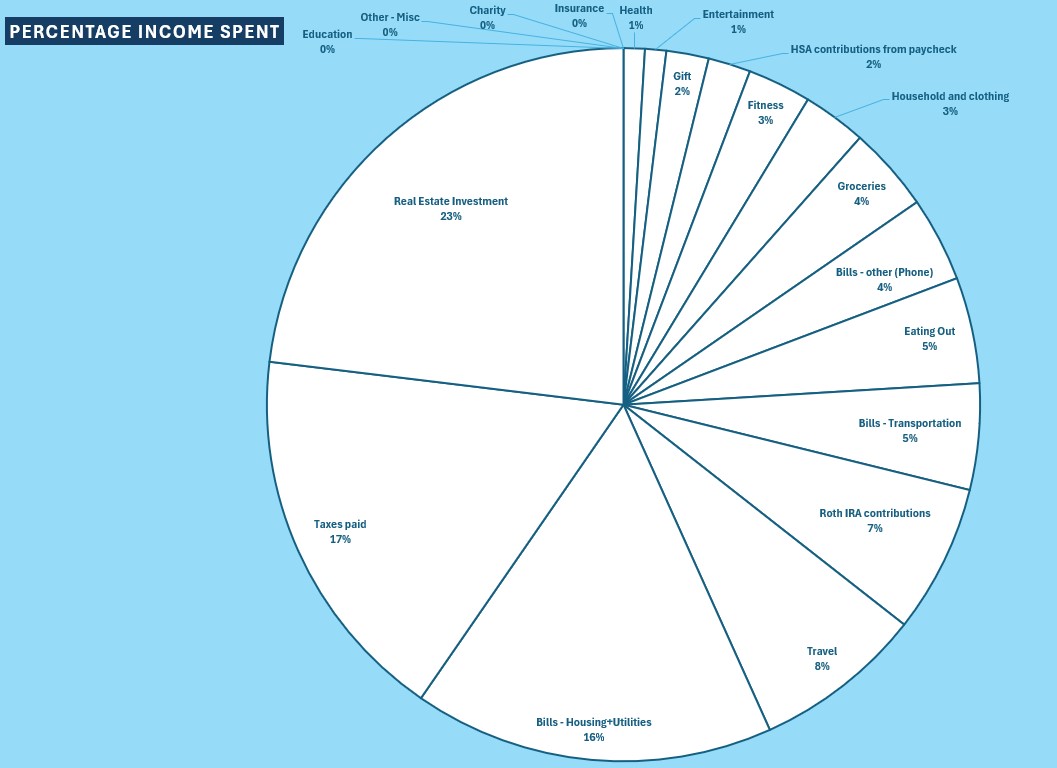
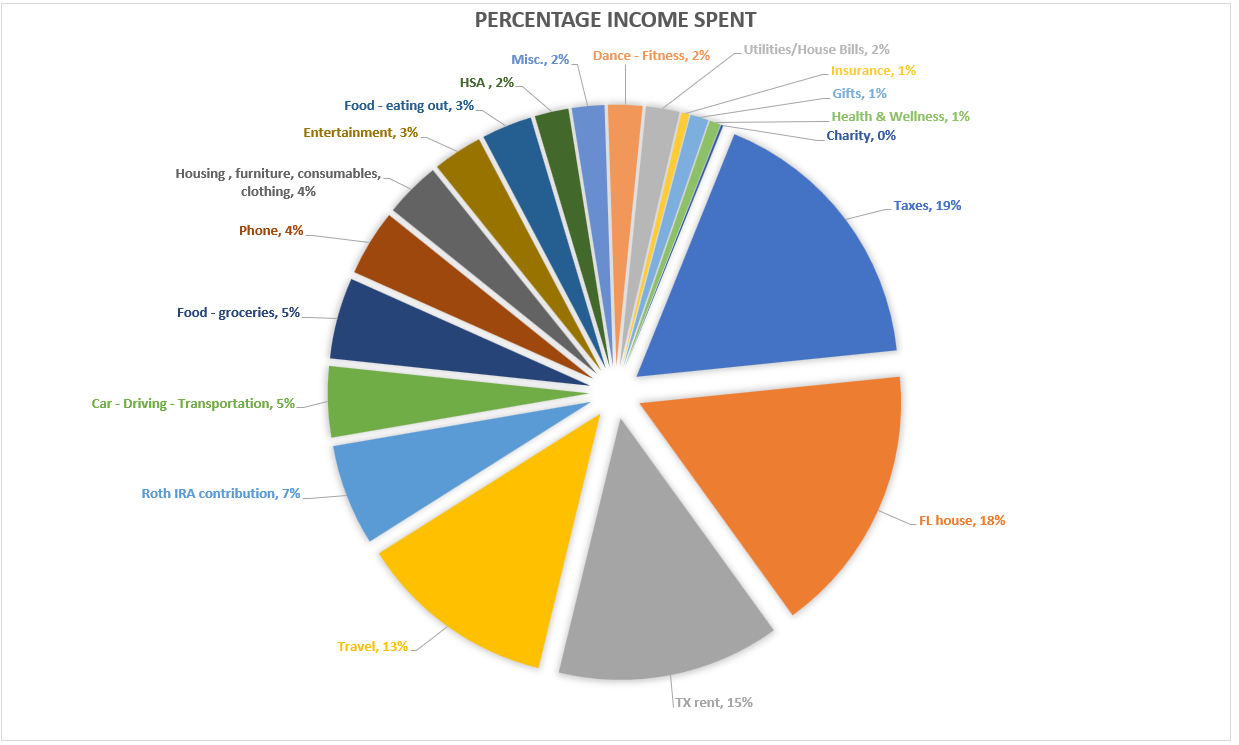
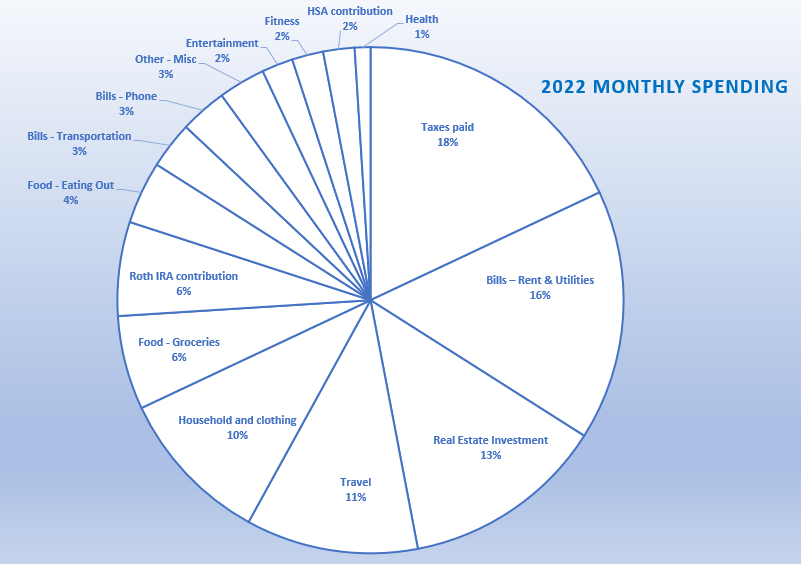
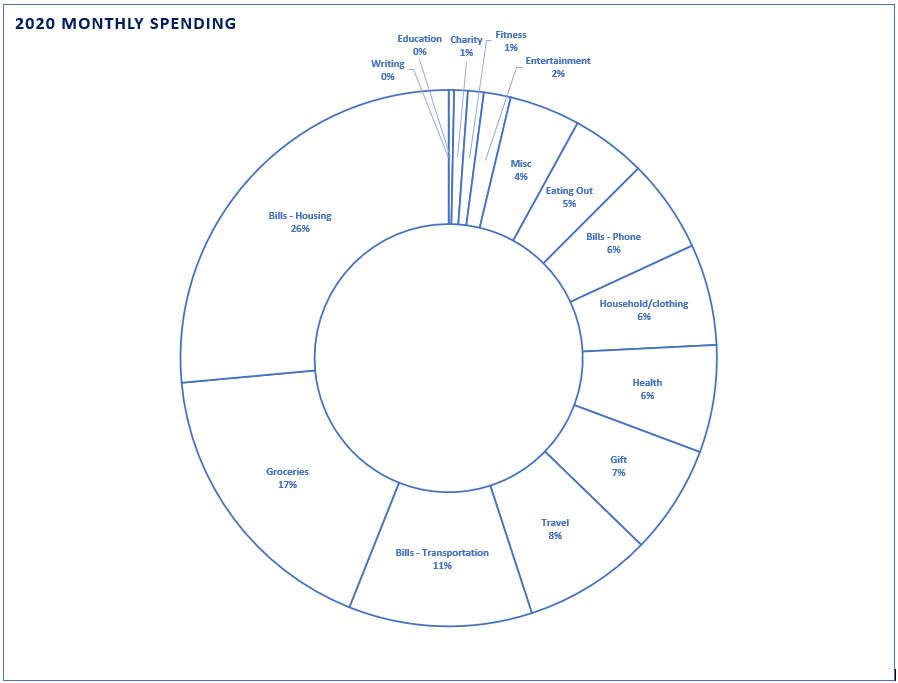
I look at how much I adhered to my monthly budgeting over the year and compare it to previous years’ spending:
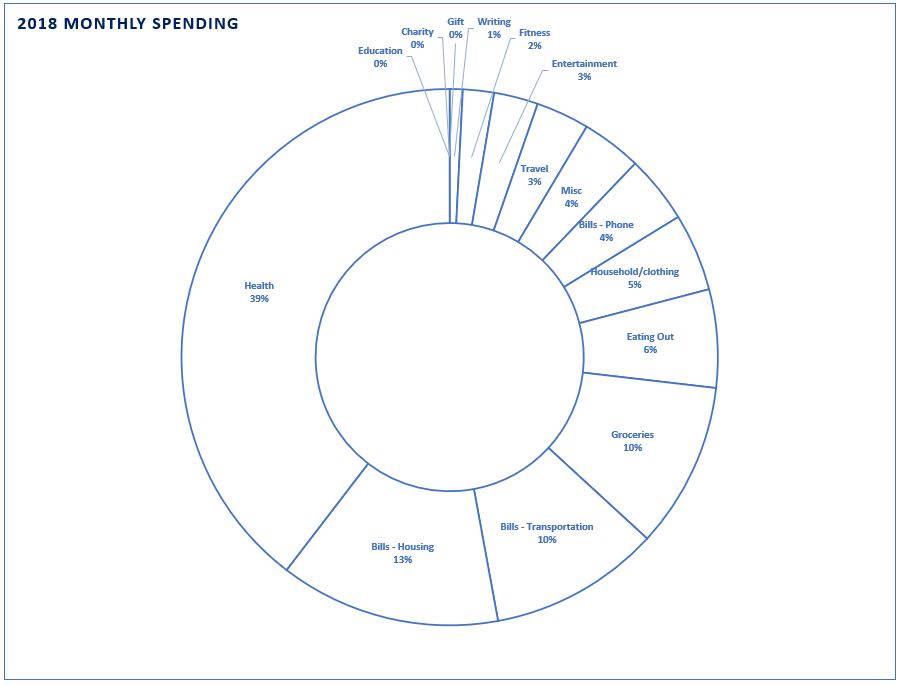
| 2018 | 2019 | 2020 | 2021 | 2022 | 2023 | 2024 | 2025 | |
| Education | na | 2% | 0% | 0% | 0% | 0% | <1% | <1% |
| Other – Misc | 2% | 0% | 3% | 1% | 3% | 2% | <1% | 1% |
| Charity | na | 1% | 1% | 1% | 0% | 0% | <1% | <1% |
| Insurance | na | na | na | na | na | na | <1% | 4% |
| Health | 27% | 2% | 4% | 2% | 1% | 1% | 1% | 1% |
| Entertainment | 2% | 1% | 1% | 1% | 2% | 3% | 1% | 1% |
| Gift | na | 2% | 4% | 3% | 0% | 1% | 2% | 1% |
| HSA contributions from paycheck | 5% | na | na | 4% | 2% | 2% | 2% | 0% |
| Fitness | 1% | 1% | 1% | 4% | 2% | 2% | 3% | 1% |
| Household and clothing | 3% | 1% | 4% | 2% | 10% | 4% | 3% | 3% |
| Groceries | 7% | 10% | 11% | 10% | 6% | 5% | 4% | 4% |
| Bills – other (Phone) | 3% | 1% | 4% | 3% | 3% | 4% | 4% | 3% |
| Eating Out | 4% | 8% | 3% | 5% | 4% | 3% | 5% | 4% |
| Bills – Transportation | 7% | 9% | 7% | 4% | 3% | 5% | 5% | 4% |
| Roth IRA contributions | 9% | 12% | 12% | 9% | 6% | 7% | 7% | 6% |
| Travel | 2% | 5% | 5% | 3% | 11% | 13% | 8% | 17% |
| Bills – Housing+Utilities | 9% | 17% | 17% | 14% | 16% | 15% | 17% | 13% |
| Taxes paid | 19% | 28% | 25% | 22% | 18% | 19% | 18% | 17% |
| Real Estate Investment | na | na | na | 12% | 13% | 18% | 24% | 20% |